By Roushni Nair
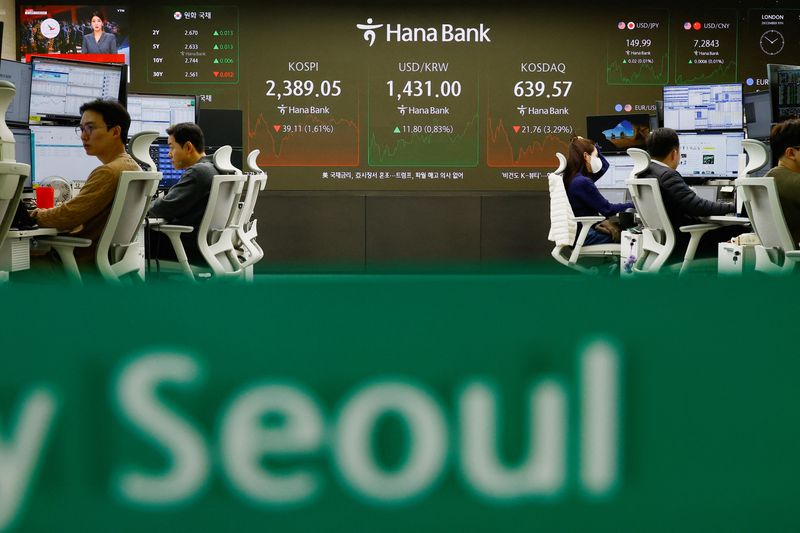
(Reuters) – Bearish bets on the South Korean won and Indian rupee rose to two-year highs as investors held on to their short positions in other currencies on growing concerns that potential U.S. tariffs would dampen the appeal of emerging market assets undermine.
Short positions on the won rose to the highest level since mid-October 2022, while those on the Indian rupee rose to the sharpest level since early November 2022, a Reuters poll of eleven respondents showed on Thursday.
U.S. President Donald Trump’s threatened tariffs on China, Southeast Asia’s largest trading partner, could fuel inflation, leading to a more cautious Federal Reserve and shallower U.S. interest rate cuts, with potential ripple effects on emerging market currencies .
Bearish bets on China’s yuan retreated somewhat as market expectations for stimulus increased following a meeting of top Communist Party officials, who vowed to stabilize the country’s real estate and stock markets.
Chinese officials are preparing to take extraordinary economic measures, including a possible weakening of the yuan, to counter the impact of expected higher trade tariffs under Trump, which will provide renewed headwinds for Asian currencies that are sensitive to the yuan.
“RMB will still be affected if Trump imposes tariffs. The uncertainty here is the timing, size and scope. But for now, the daily CNY fixing pattern (below 7.20) suggests that policymakers are likely to stick to the game plan by using the solution to manage RMB expectations for now until rates rise (if applicable),” says Christopher Wong, currency strategist at OCBC.
In South Korea, the won fell nearly 2% last week after President Yoon Suk Yeol’s brief declaration of martial law and subsequent reversal sparked political unrest, denting investor sentiment.
Fears of US tariffs and an unexpected rate cut by the Bank of Korea coincided with a 14-month export slump in the country, reflecting growing concerns about trade tensions and weakened US demand.
“could continue to hover at 1,420 in the first half of 2025 amid rate risks and political uncertainty, but we expect a gradual recovery in the second half of the year as political unrest subsides, while Korean growth could pick up with a rebound in the semiconductor industry and lower interest rates,” Wei said. Liang Chang, currency and credit strategist at DBS, said.
In India, the rupee has hit record lows three times since last week, reflecting slowing economic growth, continued foreign investment outflows and the ripple effect of volatile regional currencies, including the weakening Chinese yuan.
“Indian policymakers may continue to smooth out INR volatility, and we expect to gradually move higher on expectations of a potential reserve. Bank of India (NS:) interest rate cut in February,” Chang said.
Short positions on the Thai baht have fallen significantly after last week’s data showed the number of foreign tourists rose 28% this year, while another expected 4% growth in exports, both crucial for the second largest economy in Southeast Asia.
Bearish bets on the Indonesian rupiah, Malaysian ringgit and Philippine peso have also declined.
The Asian currency positioning poll focuses on what analysts and fund managers believe are the current market positions in nine Asian emerging market currencies: the Chinese Yuan, the South Korean Won, the Singapore Dollar, the Indonesian Rupiah, the Taiwan Dollar , the Indian rupee, the Philippine peso, the Malaysian ringgit and the Thai baht.
The poll uses estimates of net long or short positions on a scale of minus 3 to plus 3. A score of plus 3 indicates that the market is significantly long in US dollars.
The figures include positions via non-deliverable forwards (NDFs).
Below are the survey results (US dollar positions versus each currency):
DATE USD/KRW USD/INR
11-dec-24 1.15 1.86 0.83 0.87 0.82 1.43 0.65 0.53 0.26
28-Nov-24 1.32 1.45 1.12 1.03 1.10 1.13 0.76 1.13 0.66
14-Nov-24 1.14 1.61 0.80 0.81 1.07 0.87 0.65 1.18 0.90
31-Oct-24 0.30 1.06 -0.03 0.59 0.60 0.82 0.11 0.81 0.09
17-Oct-24 -0.43 0.26 -0.44 0.04 0.24 0.67 -0.40 0.26 -0.28
03-Oct-2024 -1.14 -0.79 -1.26 -1.08 -0.59 -0.04 -1.18 -0.70 -1.45
19-Sep-2024 -0.67 -0.90 -1.12 -1.18 -0.66 0.33 -1.30 -1.10 -1.33
05-Sep-24 -0.85 -1.09 -1.26 -1.05 -0.77 0.21 -1.46 -1.00 -1.22

22-Aug-24 -0.62 -0.93 -1.08 -1.26 -0.70 0.21 -1.57 -1.03 -1.16
08-Aug-24 -0.02 0.05 -0.61 -0.02 0.59 0.60 -0.78 -0.29 -0.57


