

- BEAM crypto showed signs of a breakout as trading volume rose and the price nears resistance.
- Mixed on-chain signals revealed cautious sentiment, with limited big-holder activity despite rising interest.
Beam’s [BEAM] trading volume recently surged by 21%, with its price rising by 3%. This suggested a potential shift in momentum.
At press time, the altcoin was trading at approximately $0.01878, showing signs of upward movement.
However, whether this momentum can trigger a breakout from its consolidation zone remains to be seen.
Is BEAM ready to break out of its range?
BEAM has been trading within a tight range between $0.015 and $0.022, reflecting a period of consolidation. This extended range suggested a balance between buyers and sellers, with neither side gaining an edge.
However, with the recent increase in volume, BEAM could be gearing up to break out of this range. Consequently, a breakout could signal a new trend.
BEAM faced a significant resistance level at $0.02034, which marks the top of its consolidation range. A breakout above this resistance would likely propel BEAM toward the next major level at $0.03130, offering a 65.11% potential upside.
Conversely, the $0.015 support level is crucial in containing any downside, reinforcing the range’s lower boundary.
Therefore, these levels are essential in determining BEAM’s next direction. If it breaks above $0.02034, it may initiate a rally toward the $0.03130 target.
Furthermore, the chart indicated that a brief pullback to $0.02034 could act as a retest. This strengthened the support and provided an ideal entry point for traders.
Consequently, this pullback could confirm a sustained breakout, attracting more buyers.
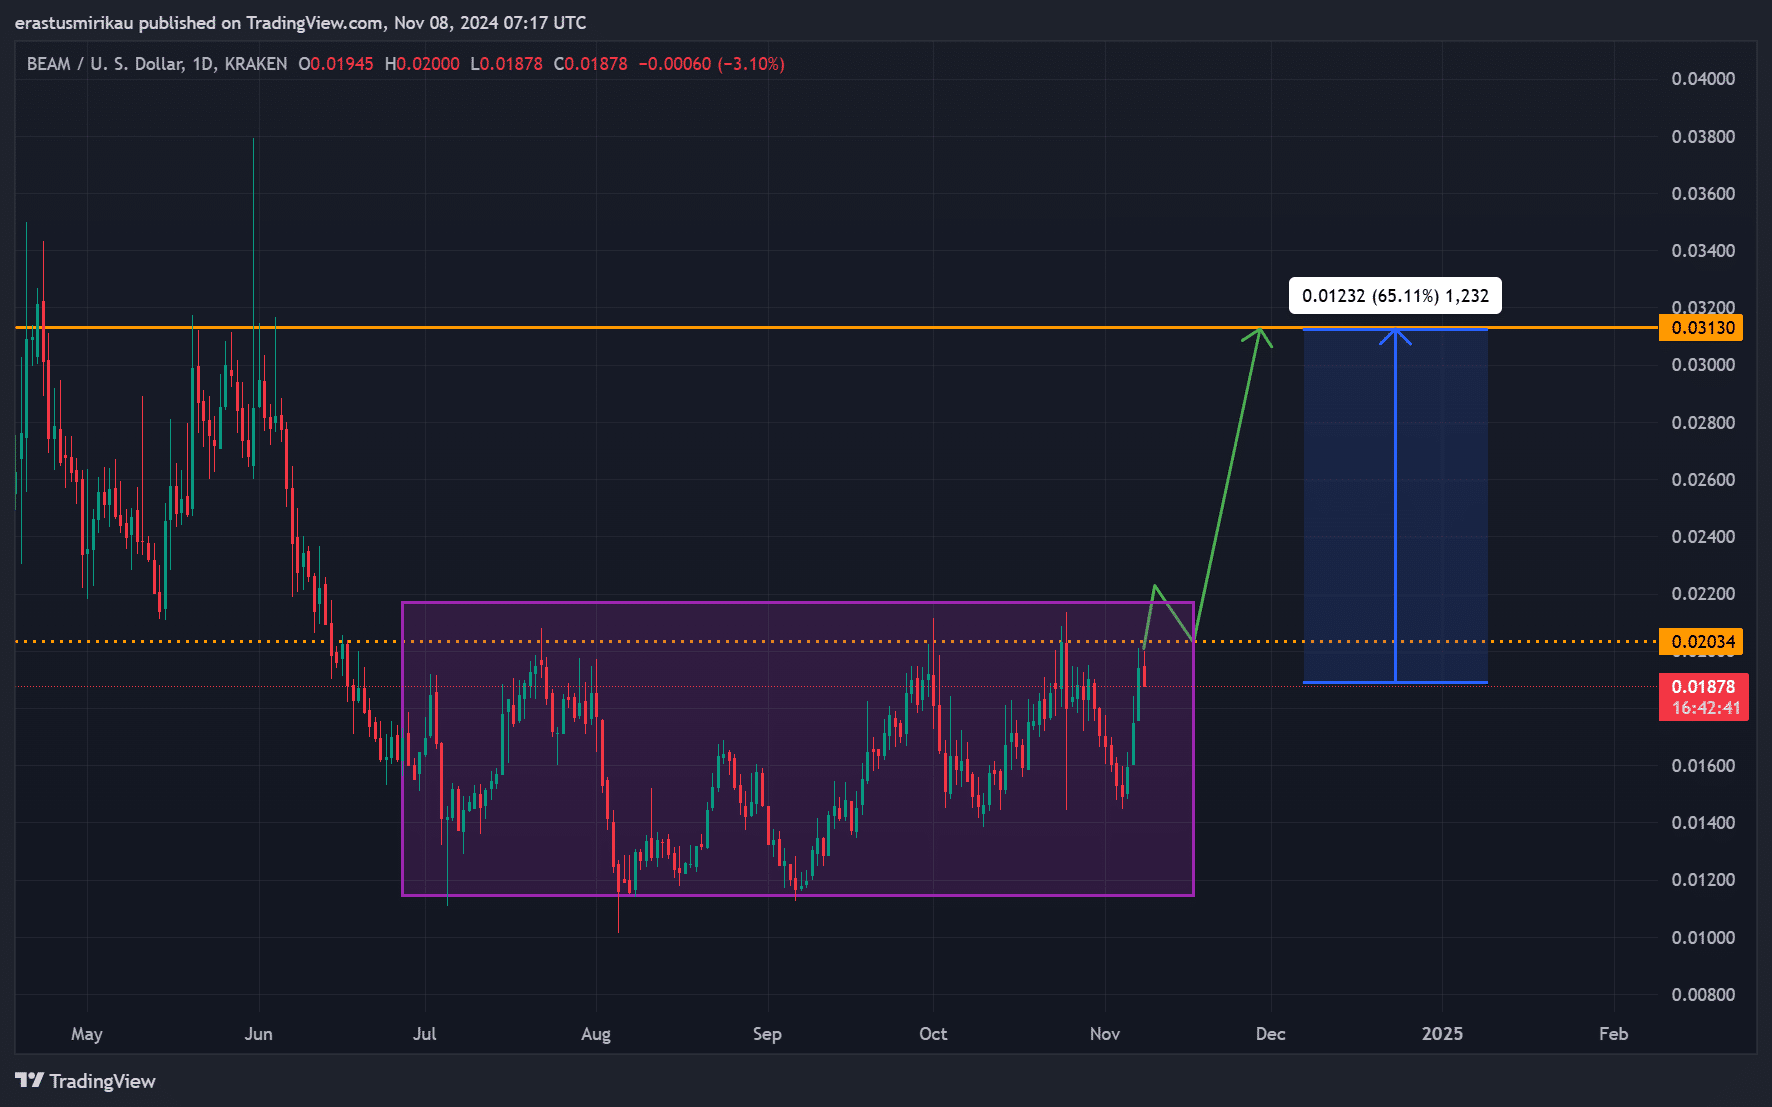
Source: TradingView
BEAM technical indicators show…
Technical indicators offer insights into BEAM’s momentum, the MACD recently showed a bullish crossover. This hinted at increasing momentum.
However, the histogram remains minimal, signaling that the bullish move is still cautious.
Additionally, the Stochastic RSI shows BEAM near overbought levels, indicating a potential short-term pullback before further gains. Therefore, while momentum is building, it’s essential to watch for a retest before committing.
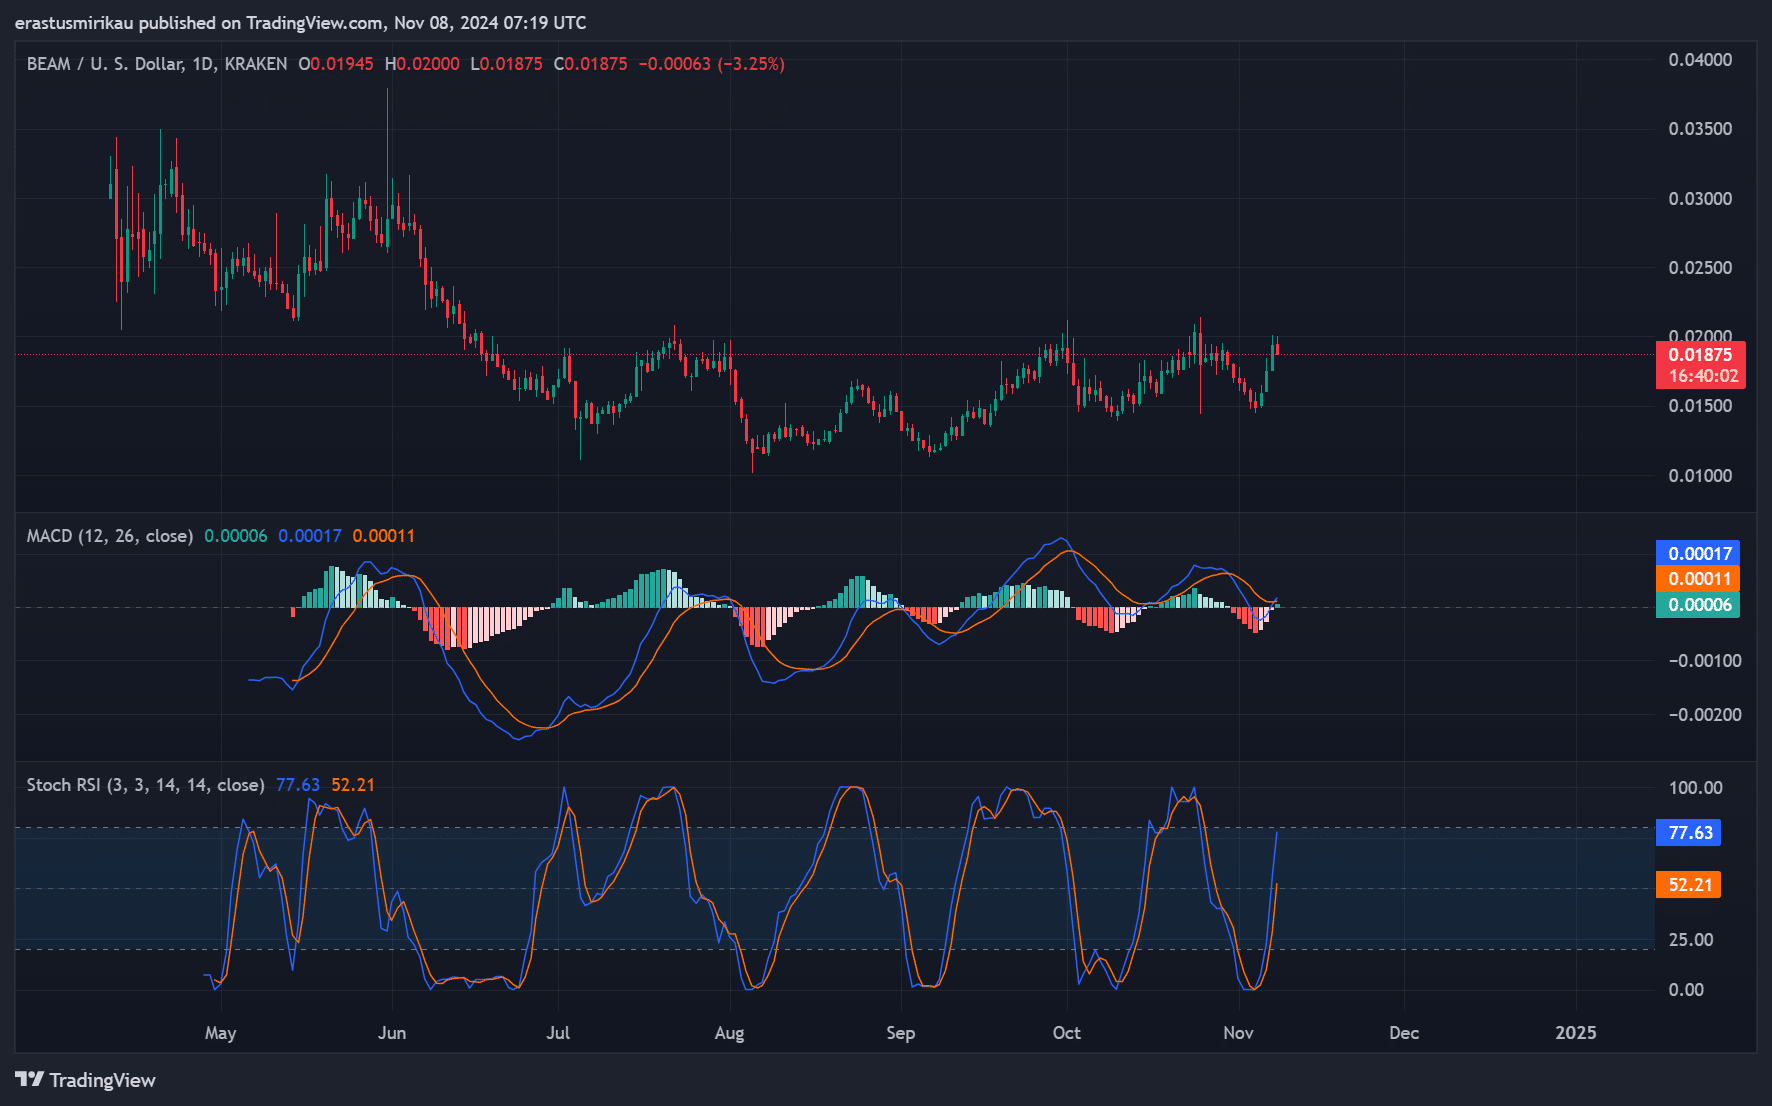
Source: TradingView
Can BEAM’s price rally without more address activity?
The Daily Active Address (DAA) divergence showed an 80.3% negative reading. This on-chain metric highlights a significant disparity between price action and address activity, often a bearish sign.
Consequently, despite BEAM’s price rise, the low address activity may question the rally’s sustainability.
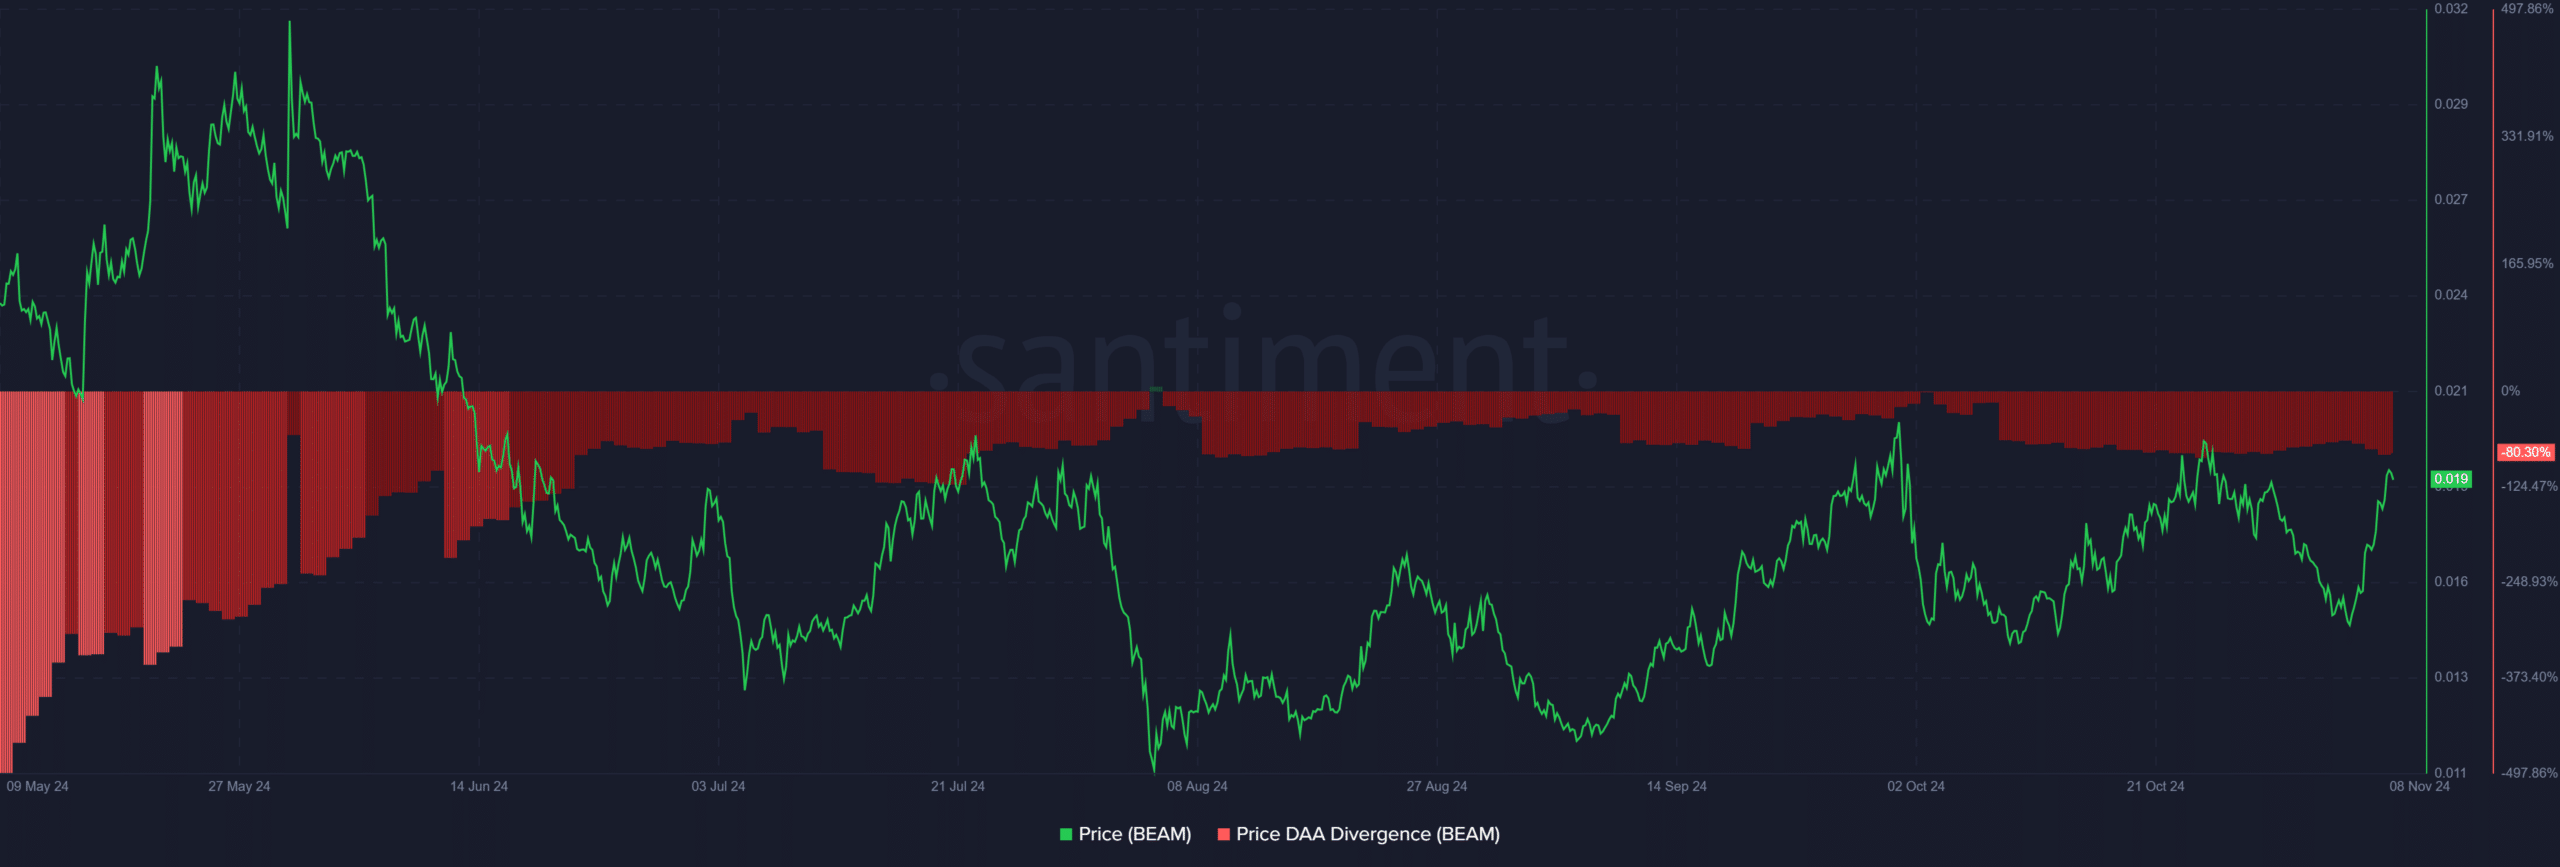
Source: Santiment
Mixed on-chain signals: Are big holders cautious?
The on-chain data presents a complex picture. Net network growth was up by 1.11%, but it’s categorized as bearish.
Meanwhile, the “In the Money” metric stood at 31.44% on the bullish territory. This indicated that many holders are currently profitable.
Additionally, BEAM’s concentration metric is slightly bullish, while large transactions dropped by 1.98%, suggesting decreased interest from big players.
Therefore, while retail activity appears strong, large holders seem cautious.
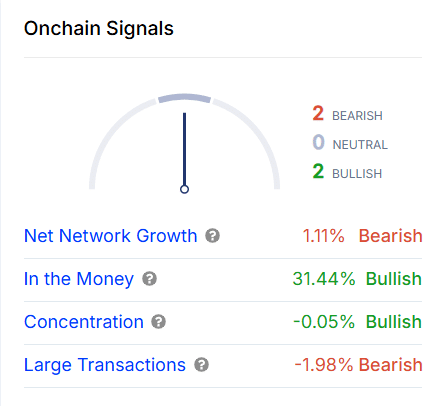
Source: IntoTheBlock
Realistic or not, here’s BEAM’s market cap in BTC’s terms
BEAM’s rising volume and price indicate growing interest, potentially leading to a breakout. However, with mixed technical and on-chain signals, the breakout scenario requires cautious optimism.
A move above $0.02034 with solid volume could set BEAM on a path toward $0.03130, but traders should wait for confirmation at key levels to minimize risk.
